Food Cost Formula: How to Calculate Food Cost % and Price Every Menu Item
The food cost formula is: food cost % = cost of goods sold ÷ food sales × 100. For one dish, divide the plate cost by the menu price. To set a price, divide the plate cost by your target food cost %. A $3.80 plate at a 30% target sells for about $12.67. This guide shows every formula with worked numbers and a copyable costing template.
Key Takeaways
- Plate cost is the sum of every ingredient in one portion, adjusted for trim and waste.
- Item food cost % = plate cost ÷ menu price × 100. Period food cost % = (beginning inventory + purchases - ending inventory) ÷ food sales × 100.
- Menu price = plate cost ÷ target food cost %. A 30% target means a 3.33x multiplier.
- U.S. restaurants spent about 32% of sales on food and non-alcoholic beverages in 2024, according to National Restaurant Association medians reported by UpMenu. Use it as a reality check, not a target.
- A percentage alone can mislead. Rank dishes by dollars of margin too, using the menu engineering matrix.
Table of Contents
- 1. Calculate plate cost for every dish
- 2. Calculate food cost % for each menu item
- 3. Set the price from a target food cost %
- 4. Calculate period food cost from inventory
- 5. Compare with benchmarks, including prime cost
- 6. Use menu engineering to rank dishes
- 7. Copy the recipe costing template
- 8. Update prices when ingredient costs move
Most restaurant owners know their food cost matters. Fewer can say which of their 40 dishes loses money. The steps below fix that. You need a spreadsheet, a scale, and your last few supplier invoices.
1. Calculate Plate Cost for Every Dish
Plate cost (also called recipe cost or portion cost) is what the ingredients of one serving cost you. Count everything on the plate, including sauces, garnish, oil, and the side. Skipping the small items is the most common reason a dish looks more profitable than it is.
Plate cost formula: plate cost = sum of (quantity used × cost per unit) for every ingredient.
Here is a worked example for a chicken burger with fries:
| Ingredient | Quantity used | Supplier price | Cost per portion |
|---|---|---|---|
| Brioche bun | 1 bun | $0.60 each | $0.60 |
| Chicken thigh | 6 oz | $4.80 per lb | $1.80 |
| Cheddar | 0.75 oz | $6.40 per lb | $0.30 |
| Lettuce | 1 leaf | estimate | $0.12 |
| Tomato | 2 slices | estimate | $0.15 |
| House sauce | 1 oz | recipe cost | $0.20 |
| Fries | 5 oz | $1.60 per lb | $0.50 |
| Ketchup, pickle, packaging | 1 set | estimate | $0.13 |
| Plate cost | $3.80 |
To get cost per ounce, divide the price per pound by 16. The cheddar is $6.40 ÷ 16 = $0.40 per oz, so 0.75 oz costs $0.30. The fries are $1.60 ÷ 16 = $0.10 per oz, so 5 oz costs $0.50.
Adjust for yield (trim and cooking loss)
You pay for the product as purchased (AP). You serve the edible portion (EP). If you lose 20% to trim, your usable cost is higher than the invoice price.
Yield formula: usable cost per lb = purchase price per lb ÷ yield %.
Example: beef tenderloin costs $18.00 per lb and trims to an 80% yield. Usable cost is $18.00 ÷ 0.80 = $22.50 per lb. A 6 oz portion is 0.375 lb × $22.50 = $8.44. Without the yield adjustment you would write $6.75 and underprice the dish by $1.69.
2. Calculate Food Cost % for Each Menu Item
Item food cost % shows what share of the menu price goes to ingredients.
Formula: item food cost % = plate cost ÷ menu price × 100.
The chicken burger costs $3.80 to make and sells for $13.00. That gives $3.80 ÷ $13.00 × 100 = 29.2%. The gross profit is $13.00 - $3.80 = $9.20 per burger.
Run this for every item and sort the list from highest to lowest. The top of the list needs attention first.
3. Set the Price From a Target Food Cost %
This is the core of menu pricing. Pick a target food cost % for the dish, then work backward.
Formula: menu price = plate cost ÷ target food cost %.
The same $3.80 burger at different targets:
| Target food cost % | Calculation | Raw price | Rounded menu price | Actual food cost % |
|---|---|---|---|---|
| 28% | $3.80 ÷ 0.28 | $13.57 | $13.95 | 27.2% |
| 30% | $3.80 ÷ 0.30 | $12.67 | $12.95 | 29.3% |
| 32% | $3.80 ÷ 0.32 | $11.88 | $11.95 | 31.8% |
| 35% | $3.80 ÷ 0.35 | $10.86 | $10.95 | 34.7% |
A shortcut is the multiplier. Divide 1 by your target: 1 ÷ 0.30 = 3.33. Multiply the plate cost by 3.33 to get the price. A 4x multiplier equals a 25% target.
Why the formula is a starting point, not the answer
- Market price. If the burger place down the street charges $11, a $12.95 price needs a reason: bigger portion, better bun, a photo that sells it.
- Different targets per category. Pasta and pizza usually carry lower food cost % than steak. Pricing every dish at one flat percentage can make the premium items too expensive and leave margin on the table elsewhere.
- Psychological price points. Round to prices that feel natural in your market ($12.95, $13, or $12.50), then recheck the real percentage.
Use a menu pricing calculator or spreadsheet for the arithmetic, but make the final call yourself. The formula does not know your neighborhood.
4. Calculate Period Food Cost From Inventory
Item costs are theoretical. Period food cost tells you what you actually spent. Run it weekly or monthly, using the same inventory dates every time.
Formula:
- Cost of goods sold (COGS) = beginning inventory + purchases - ending inventory
- Food cost % = COGS ÷ food sales × 100
Worked example for one month:
| Line | Amount |
|---|---|
| Beginning inventory (value on day 1) | $14,000 |
| + Purchases during the month | $21,500 |
| - Ending inventory (value on last day) | $12,500 |
| = COGS | $23,000 |
| Food sales | $72,000 |
| Actual food cost % | 31.9% ($23,000 ÷ $72,000) |
Compare actual with theoretical (ideal) food cost
Theoretical food cost uses your plate costs and your sales mix. Multiply units sold by plate cost for every item, add them up, and divide by food sales. Suppose this gives $21,240.
- Theoretical food cost = $21,240 ÷ $72,000 = 29.5%
- Actual food cost = 31.9%
- Gap = 2.4 percentage points, or $1,760 of food that left the building without being sold
That gap is waste, over-portioning, theft, spoilage, comps, or recipe costs that are out of date. Toast explains that actual cost will always run above theoretical, because theory assumes no breakage or shrinkage. A small gap is normal. A growing gap is a signal to investigate.
5. Compare With Benchmarks, Including Prime Cost
Benchmarks help you check your numbers. They do not replace your own costs and concept.
| Metric | Benchmark | Source |
|---|---|---|
| Food and non-alcoholic beverage cost, all full-service restaurants (2024 median) | 32.0% of sales | UpMenu, citing National Restaurant Association medians |
| Same, limited-service (2024 median) | 32.4% of sales | Same source |
| Prime cost, full-service | 60-65% of sales | Restaurant365 |
| Prime cost, quick-service | 55-60% of sales | Same source |
The same UpMenu page says: "No single number is ideal, but industry medians are a useful reality check." A steakhouse, a taqueria, and a pizzeria will land in different places. Compare against your own history first.
Prime cost: the number that includes labor
Food cost alone hides a trap. You can cut food cost by buying cheaper product and then pay for it in prep labor or lower quality. Prime cost combines both.
Formula: prime cost = cost of goods sold + total labor cost. Prime cost % = prime cost ÷ total sales × 100.
Example: a month with $80,000 in net sales, $25,400 in COGS (food and beverage), and $22,600 in labor (wages, taxes, benefits). Prime cost is $48,000. Prime cost % is $48,000 ÷ $80,000 = 60.0%. That sits at the low end of the full-service range above.
6. Use Menu Engineering to Rank Your Dishes
Food cost % tells you how much of the price is ingredients. It does not tell you how many dollars the dish earns. Menu engineering adds popularity to the picture. The framework was developed by Michael Kasavana and Donald Smith at Michigan State University in the 1980s. It sorts each dish by units sold and by contribution margin (menu price minus plate cost, in dollars). Dishes that sell well with a high margin are Stars. Dishes that sell well with a low margin are Plowhorses. Dishes with a high margin that sell little are Puzzles. Dishes weak on both are Dogs.
Use this only as a ranking aid. A dish with a high food cost % can still earn the most dollars, so do not cut a dish on food cost % alone. Test one change at a time and watch the next month's sales mix.
7. Copy the Recipe Costing Template
Paste this table into a spreadsheet. Make one sheet per dish. Fill in purchase data and quantity, and let the formulas do the rest.
| Ingredient | Purchase unit | Purchase price | Yield % | Usable cost per unit | Qty used | Line cost |
|---|---|---|---|---|---|---|
| Example: beef tenderloin | lb | $18.00 | 80% | $22.50 per lb | 0.375 lb | $8.44 |
| Garnish, oil, seasoning, packaging | estimate | |||||
| Plate cost (sum of line costs) | $ | |||||
| Target food cost % | % | |||||
| Calculated price (plate cost ÷ target %) | $ | |||||
| Menu price after rounding | $ | |||||
| Actual food cost % (plate cost ÷ menu price) | % | |||||
| Contribution margin (menu price - plate cost) | $ | |||||
Spreadsheet formulas, assuming purchase price in column C and yield in column D:
- Usable cost per unit:
=C2/D2(enter yield as 0.80) - Line cost:
=E2*F2 - Plate cost:
=SUM(G2:G10) - Calculated price:
=PlateCost/TargetPct - Actual food cost %:
=PlateCost/MenuPrice
Keep an "invoice date" column on the sheet. Costs are only as good as the last invoice you checked.

8. Update Prices When Ingredient Costs Move
Costing is not a one-time job. Ingredient prices change, and a stale menu quietly eats margin.
Example: chicken thigh rises 10%, from $4.80 to $5.28 per lb. The chicken line goes from $1.80 to $1.98 and plate cost from $3.80 to $3.98. At the $12.95 price, food cost % moves from 29.3% to $3.98 ÷ $12.95 = 30.7%. To get back near 29.3%, the price would need to be about $13.56. Rounded to $13.50, the item sits at 29.5%.
A simple routine
- Weekly: update prices for your 10 highest-cost ingredients (proteins, dairy, oil, produce that swings).
- Monthly: recalculate plate costs and re-rank dishes by contribution margin and units sold.
- Quarterly: decide on price changes. Change a few items at a time and favor Stars and Puzzles, where guests are less price-sensitive than on a Plowhorse everyone orders.
- Any big swing: reprice the affected dishes now, not at the next reprint.
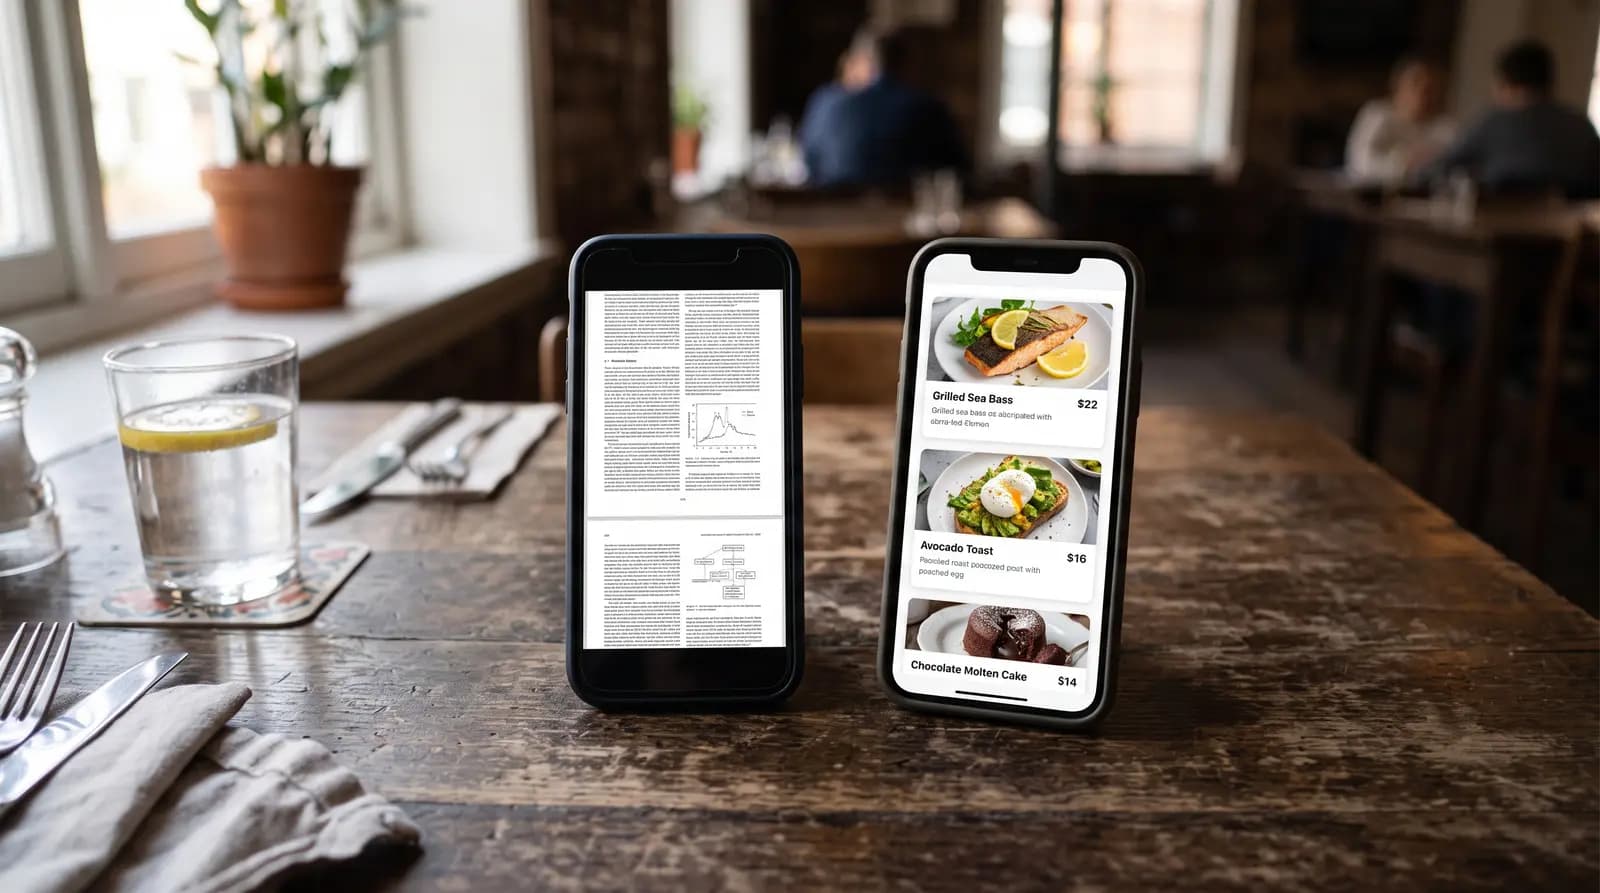
The bottleneck is often the menu itself. A printed or PDF menu can take days to update, so prices stay wrong for weeks. An editable QR menu removes that delay: you change the price in a dashboard and guests see it the moment they scan. See also what traditional paper menus cost and how much reprinting adds up to over a year.
Reprice without reprinting. QR Menu Generator lets you edit prices and dishes any time, and changes show instantly. The free plan includes 1 restaurant, 10 categories, and 30 products. Create your free menu or view the demo. Paid plans are on the pricing page.
Bottom line: cost every plate, price from a target, check the result against real inventory, and rank dishes by dollars of margin. Then keep the numbers fresh. Exact figures in this guide are examples; use your own invoices and sales data.
Frequently Asked Questions
- What is the food cost formula?
- For one dish: food cost % = plate cost ÷ menu price × 100. For a period: food cost % = (beginning inventory + purchases - ending inventory) ÷ food sales × 100. The first is theoretical. The second is what you actually spent.
- What is a good food cost percentage for a restaurant?
- There is no single ideal number. U.S. restaurants spent about 32% of sales on food and non-alcoholic beverages in 2024, per NRA medians reported by UpMenu. Limited-service was 32.4% and full-service 32.0%. Your concept, menu mix, and pricing decide your own target.
- How do I calculate the menu price from food cost?
- Divide the plate cost by your target food cost %. A $3.80 plate at a 30% target gives $3.80 ÷ 0.30 = $12.67. Round to a natural price point such as $12.95, then recheck the real percentage (29.3%).
- What is prime cost and why does it matter?
- Prime cost is cost of goods sold plus total labor, divided by sales. Restaurant365 gives 60-65% for full-service and 55-60% for quick-service. It matters because it catches savings on food that are paid back in labor.
- What are stars, plowhorses, puzzles, and dogs?
- They are the four dish types in a menu engineering review. Stars sell well and earn a high margin. Plowhorses sell well but earn little. Puzzles earn a lot but sell little. Dogs are weak on both. Margin is measured in dollars, not percent.
- How often should I update my food costs?
- Update key ingredient prices weekly, recalculate plate costs monthly, and review menu prices quarterly. Act sooner after a large supplier price change. Keep an invoice date on every costing sheet.
About the author
Evrenus Fırat Polat
Restaurant technology expert and founder of QR Menu Generator. Passionate about helping restaurant owners harness digital tools to grow their business.